 |  |
Friday, September 28, 2012
Economic Report 2012/2013: Federal Govt revenue at RM208.7b in 2013
Economic Report 2012/2013: Federal Govt revenue at RM208.7b in 2013: The Federal Government's revenue for 2013 is expected to be marginally higher by 0.7% to RM208.70bil, partly due to high-base effect in 2012, supported by higher tax revenue with increases seen in sales taxes and individual tax collection.


Friday, September 21, 2012
BlackRock’s Doll Likes Healthcare, Technology Stocks
BlackRock’s Doll Likes Healthcare, Technology Stocks:
July 27 (Bloomberg) — Bob Doll, chief equity strategist at BlackRock Inc., talks about the impact of a political impasse over the US debt ceiling on financial markets and his investment strategy. Doll speaks with Susan Li on Bloomberg Television’s “First Up.” (Source: Bloomberg)

 Lesson I’m Learning From Within The Elevation Group (category: elevation group)
Bob Wick‘s Direct Link To >>> The Elevation Group
What others are learning through Bob’s Link!
Use Facebook to Comment on this Post
Thursday, September 20, 2012
How to Hedge Bursa Malaysia stock market KLCI with FKLI?
How to Hedge Bursa Malaysia stock market KLCI with FKLI?:
Thanks

Recently I started investing in Futures and Options to hedge my equity position. I wanted to do it long time ago but the question is how to hedge using FKLI? FKLI is the Futures product for KLCI.
The obvious answer will be Short FKLI. If the market up, I will lose money in FKLI but I make from equity. If the market down, my share value will drop but I will make from FKLI. However, with this kind of hedging, what do I make? If market up I will not be making much because I will lose in FKLI.
Then I thought of I normally can perform better than KLCI. Meaning if my stocks value up 10% maybe KLCI up just 7%, I make 10% and lose 7%, net make 3%. But this is too little. Although the risk is much lower as I’m not worried about market crash, the return is too little. If during bull run also I will make very little.
Then I thought of buying FKLI Put Options OKLI. For example I pay 0.8% every month to buy Options. 0.8% is the maximum that I can lose within a month.
If the market down 3% within the month, I make 2.2% (after minus 0.8%)
If market down 0.5%, I lose 0.3%.
If the market up 9% within the month, I lose only 0.8% because that is the maximum I will lose and I will make 9% from equity, the net gain is 8.2%.
If market unchanged, I lose 0.8%.
But I was thinking, if the market keep going up gradually, assuming within the year Mr A make 20% from his equity portfolio, but Mr A will lose 0.8% X 12 months = 9.6%. Meaning Mr A will only make 10.4% net. Although market fluctuate within the year, if market is on uptrend, from rough estimate most probably Mr A will make about 14% to 15%%, as compared with 20% if he didn’t hedge.
If market down 20%, Mr A will make 20% minus 9.6% = 10.4% from FKLI. If adjusted for market fluctuation, rough estimate Mr A will make about 8% but lose 20% from equity.
If I average out the market up and the market down, it appears that with Options, Mr A will make about 2% to 3% for the two years combined as compared with Zero if without Options. But one thing we must understanding, for long term the market is generally on the uptrend. Assuming now is year 2008 where the KLCI was down and at lower range, if we look at the KLCI 10 years ago from 2008 to 1998, 20 years ago 1988 or 30 years ago 1978, the 2008 index point is generally higher.
On the longer term, Mr A will keep losing on Options and making from Equity. But because of the losses in Options his profit from Equity will be lower than the profit without hedging.
Another issue is why we need to worry about market crash, why need to hedge? If market crash, we will be able to buy cheap stocks and later will make substantial profit once the market recover.
After much thought, I have decided not to hedge equity portfolio with FKLI futures. Of course the above is just some rough estimate, I am not a speculator, I am merely doing investing without a need to predict the market because I don’t know how to predict the market.
Then few weeks ago, I found a way that “MAYBE” I can actually hedge my equity portfolio, without losing much money from hedging in the long run. Meaning if the market is on the uptrend, I will make from equity but will not lose much from Futures or Options. In fact, with the hedging there is a possibility that “MAYBE” I can make from both Equity and Futures and Options.
Is that possible? Let me try it out for one year or go through market crash and I will know the answer.
Please click facebook "LIKE" in my blog if you like my blog.
If you are using mobile, please click/change to web base in order to see my facebook "LIKE" and Google Friend Connect.
Thanks
Market Outlook KLCI FKLI and FCPO
Market Outlook KLCI FKLI and FCPO: For the month of September and until now, FKLI Futures still trading at discount from KLCI, meaning generally investors are still bearish. The huge discount of more than 10 points has been narrowed to only few points now.

FCPO dropped more than 100 points, in response to the drop in soybean oil prices. Wondering how it will perform when it opens on Wednesday.
Retailers fuel recovery hopes
Retailers fuel recovery hopes: LONDON, Sept 20 — Britain’s retailers performed better than feared during the Olympics in August and manufacturers’ order books improved this month, bolstering hopes that the economy is creeping out of recession even though dangers still loom large. Retail sales dipped 0.2 per cent in August as Britons abandoned online shopping to watch the ...


| |
Madoff victims to receive RM7.6 billion payout
Madoff victims to receive RM7.6 billion payout: RALEIGH, Sept 20 — Victims of Bernard Madoff’s fraud will soon receive US$2.48 billion (RM7.6 billion) to help cover their losses, more than tripling their total recovery to about US$3.63 billion, the trustee liquidating the imprisoned swindler’s firm said. Checks ranging from US$1,784 to US$526.9 million were mailed yesterday to 1,230 former ...


| |
Housing Affordability is Historically Very High
Housing Affordability is Historically Very High:
 A recent analysis by Trulia concluded that buying a home today is 45% cheaper on average compared to renting a comparable home, see CD post here. That post generated a lively discussion with about 100 comments, and some questioned some of Trulia's assumptions and analysis (or lack of some key assumptions), although I think the general conclusion is valid that buying a home is relatively affordable today compared to renting a similar home -whether it's 10%, 20%, 30% or 45% cheaper.
Another measure of housing affordability is to compare the median household income in the U.S. (or regions) to the qualifying income needed to purchase a median-priced home, and that analysis is reported monthly by the National Association of Realtors based on its Housing Affordability Index (HAI), see chart above.
In July, the Housing Affordability Index increased to 182.0 from 179.7 in June, but is down from historical highs for the HAI above 200 in the first three months of 2012. Looking back over the last thirty years, the July HAI of 182 is still very high by historical standards (see chart).
An HAI of 182.0 means that the typical American household earning the median annual family income of $61,080 in July would actually have 182% of the standard qualifying income level of $33,552 required to purchase a median-priced existing single-family house ($181,000) with a 20% down payment, financing the remaining 80% of the sales price with a 30-year fixed rate mortgage at the July average of 3.78% (monthly payment of $699 for principal and interest). For the Midwest region of the country, the HAI in July of 219 means that the typical Midwest household income of $60,657 is more than twice the qualifying income ($27,696) necessary to purchase the median price home at $155,400.
Bottom Line: Whether comparing buying to renting a home, or comparing the median household income to the qualifying income necessary to purchase a home, homeownerhip today is extremely affordable. And that historically high affordability is one of the factors that will continue to support the housing recovery taking hold across the country right now.
The impact of spam that touts stocks upon the trading activity of those stocks . Spam Works!
The impact of spam that touts stocks upon the trading activity of those stocks . Spam Works!:
Purdue University - Krannert School of Management
Harvard Law School and Kennedy School; Harvard School of Engineering and Applied Sciences; Berkman Center for Internet & Society
March 14, 2007
Berkman Center Research Publication No. 2006-11
Harvard Public Law Working Paper No. 135
Oxford Legal Studies Research Paper No. 43/2006
Abstract:
We assess the impact of spam that touts stocks upon the trading activity of those stocks and sketch how profitable such spamming might be for spammers and how harmful it is to those who heed advice in stock-touting e-mails. We find convincing evidence that stock prices are being manipulated through spam. We suggest that the effectiveness of spammed stock touting calls into question prevailing models of securities regulation that rely principally on the proper labeling of information and disclosure of conflicts of interest as means of protecting consumers, and we propose several regulatory and industry interventions.
- Based on a large sample of touted stocks listed on the Pink Sheets quotation system and a large sample of spam emails touting stocks, we find that stocks experience a significantly positive return on days prior to heavy touting via spam.
- Volume of trading responds positively and significantly to heavy touting. For a stock that is touted at some point during our sample period, the probability of it being the most actively traded stock in our sample jumps from 4% on a day when there is no touting activity to 70% on a day when there is touting activity.
- Returns in the days following touting are significantly negative. The evidence accords with a hypothesis that spammers "buy low and spam high," purchasing penny stocks with comparatively low liquidity, then touting them - perhaps immediately after an independently occurring upward tick in price, or after having caused the uptick themselves by engaging in preparatory purchasing - in order to increase or maintain trading activity and price enough to unload their positions at a profit.
- We find that prolific spamming greatly affects the trading volume of a targeted stock, drumming up buyers to prevent the spammer's initial selling from depressing the stock's price.
- Subsequent selling by the spammer (or others) while this buying pressure subsides results in negative returns following touting. Before brokerage fees, the average investor who buys a stock on the day it is most heavily touted and sells it 2 days after the touting ends will lose close to 5.5%.
- For those touted stocks with above-average levels of touting, a spammer who buys on the day before unleashing touts and sells on the day his or her touting is the heaviest, on average, will earn 4.29% before transaction costs. The underlying data and interactive charts showing price and volume changes are also made available.
Spam Works: Evidence from Stock Touts and Corresponding Market Activity
Laura Frieder
Purdue University - Krannert School of Management
Jonathan Zittrain
Harvard Law School and Kennedy School; Harvard School of Engineering and Applied Sciences; Berkman Center for Internet & Society
March 14, 2007
Berkman Center Research Publication No. 2006-11
Harvard Public Law Working Paper No. 135
Oxford Legal Studies Research Paper No. 43/2006
Abstract:
We assess the impact of spam that touts stocks upon the trading activity of those stocks and sketch how profitable such spamming might be for spammers and how harmful it is to those who heed advice in stock-touting e-mails. We find convincing evidence that stock prices are being manipulated through spam. We suggest that the effectiveness of spammed stock touting calls into question prevailing models of securities regulation that rely principally on the proper labeling of information and disclosure of conflicts of interest as means of protecting consumers, and we propose several regulatory and industry interventions.
- Based on a large sample of touted stocks listed on the Pink Sheets quotation system and a large sample of spam emails touting stocks, we find that stocks experience a significantly positive return on days prior to heavy touting via spam.
- Volume of trading responds positively and significantly to heavy touting. For a stock that is touted at some point during our sample period, the probability of it being the most actively traded stock in our sample jumps from 4% on a day when there is no touting activity to 70% on a day when there is touting activity.
- Returns in the days following touting are significantly negative. The evidence accords with a hypothesis that spammers "buy low and spam high," purchasing penny stocks with comparatively low liquidity, then touting them - perhaps immediately after an independently occurring upward tick in price, or after having caused the uptick themselves by engaging in preparatory purchasing - in order to increase or maintain trading activity and price enough to unload their positions at a profit.
- We find that prolific spamming greatly affects the trading volume of a targeted stock, drumming up buyers to prevent the spammer's initial selling from depressing the stock's price.
- Subsequent selling by the spammer (or others) while this buying pressure subsides results in negative returns following touting. Before brokerage fees, the average investor who buys a stock on the day it is most heavily touted and sells it 2 days after the touting ends will lose close to 5.5%.
- For those touted stocks with above-average levels of touting, a spammer who buys on the day before unleashing touts and sells on the day his or her touting is the heaviest, on average, will earn 4.29% before transaction costs. The underlying data and interactive charts showing price and volume changes are also made available.
Number of Pages in PDF File: 44
Keywords: spam, stock, tout, markets, e-mail, Internet, cyberlaw, SEC, unsolicited, commercial, manipulation, timing, consumer protection, pink sheets, efficiency
Health is Wealth
Bullbear Stock Investing Notes
Helping the small investor: The Magic Formula
Helping the small investor: The Magic Formula:
| Why the Formula Matters | ||||||||||||||||||||||||||||||||||||
| Many hard working, middle class people find it very difficult to make ends meet, never mind make the appropriate contribution to their retirement savings. Even those that are making regular contributions to retirement savings find it unlikely their nest egg will grow large enough to let them live the dream retirement. There is a hope! Before we get to the impact of the magic formula, you need a specific goal. Find out how much you need to retire. Use one of the online calculators to find your number and write it down. Whatever number you came up with, chances are it shows that you should be saving more for retirement, correct? But what if you really have cut back as much as you can, and you still can't find that extra money to fund your retirement? Answer: If that extra income in not available in your budget, your retirement funds must earn more. Not paying attention to this fact is the single biggest risk you have to a happy, financially secure future. One of the great things about retirement accounts is that your earnings grow tax-deferred so you can realize the full power of compound interest. So what is the big deal anyway about a few percentage points over time? Does it really make a difference whether your retirement account earns 8%, 10%, or 15% a year? YES, YES, YES! It matters! In fact this is THE most important factor you need to consider. | ||||||||||||||||||||||||||||||||||||
| The Magic Formula for Building Investment Wealth: Compound Interest | ||||||||||||||||||||||||||||||||||||
COMPOUND INTEREST (FUTURE VALUE)You vaguely remember that Junior High School math lesson on simple and compound interest don't you? Suppose you open an account that pays a specific interest rate, compounded annually. If you make no further contributions and let compound interest work its magic the balance your account will grow to at some point in the future is known as the future value of your starting principal.
The above assumes we are compounding once per year. If you want to compound n times per year, you use: FV = P(1 + r/n)Yn
THE POWER OF A HIGH COMPOUNDED INTEREST RATEObviously you and everyone else in the world knows it is better to have a high rate of return, but have you ever paid attention to the enormous impact that compound interest has on your future financial security and happieness?Let's take a simple example: Suppose you are 40 years old and have $10,000 in a self-directed IRA account. For the purpose of this example, let's assume you will never add another dollar to that account out of your own pocket. How much will that $10,000 be worth at age 65? As you can guess the answer depends drastically on your rate of return. If you were getting a 6% annual return on your investment, then in 25 years that $10,000 would turn into $42,918. How would that same amount grow with a higher rate of return?
Think about that. Without adding a dime to that account you could turn that $10,000 into almost 1 million dollars. But who's going to give you 20% interest you say? You are. We'll let you in on a 3 little secrets,
| ||||||||||||||||||||||||||||||||||||
| Take Control of your Future | ||||||||||||||||||||||||||||||||||||
"Proverb: He who fears something gives it power over him"
So how do you consistently get that 15-20% return with almost no risk? You need to manage a portion of your future for yourself. It is not that difficult once you learn how, but most people won't get started because of fear. Fear that they will lose money. Fear that they will not be able to do as well as the market. The greater risk is *not* taking some responsibility for your own future. "But I can't beat the market", you say. As we'll explain that's the wrong yardstick to begin with. You don't want to beat the market, you want to earn a consistent level of return each year. If the market looses 8% one year, who wants to "beat the market" by losing only 5% that year? Not us. And hopefully not you. We want to earn at least 15% on our retirement investment. So why are we sharing this information? Let's put it this way. We're advocates for the little guy. There are a lot of people in the financial services industry that want to manage our money because that is how they make money. They don't necessarily want us to know what they know, because then we wouldn't need them. Luckily for them, there are many investing myths out there that keep us in check. We accept these myths as truths, and that keeps us from taking action. We're not suggesting that you try to manage your entire retirement nest egg yourself. At least not immediately. Rather think of it as a new definiton of diversification. To start, leave the majority of your funds with your current 401K or IRA, but move a small percentage, maybe 10-20% to a self-directed IRA account. Get started today!
"Never be afraid to try something new.
Remember, amateurs built the ark, professionals built the Titanic." |
Health is Wealth
Bullbear Stock Investing Notes
RHB Research: IGB REIT fair value RM1.43
RHB Research: IGB REIT fair value RM1.43: RHB Research Institute has initiated coverage on IGB REIT, which will be listed on Friday, with an Outperform call and a DDM-based fair value of RM1.43, based on a cost of equity assumption of 7%. The offer price is RM1.25.
| |
Wednesday, September 12, 2012
IGB REIT IPO Oversubscribed by 21.75 times
IGB REIT IPO Oversubscribed by 21.75 times: Pavilion REIT (Real Estate Investment Trust) Initial Public Offering (IPO) received an overwhelming response with its public portion of 34 million units. It was oversubscribed by 21.75times. The IPO attracted 32,781 applications or 773.6 million units. In addition, 24.5 million units initially set aside for eligible directors and employees were made available for Malaysian Public. Institutional [...]
[[ This is a content summary only. Visit my website for full links, other content, and more! ]]

[[ This is a content summary only. Visit my website for full links, other content, and more! ]]
Monday, September 10, 2012
Bonds & Sukuk for Retail Investors
Bonds & Sukuk for Retail Investors: Recently, Securities Commission Malaysia (SC) launched the Malaysian retail bonds and sukuk framework that allows retail investors to directly invest in bonds and sukuk. The framework is part of the initiative under the SC’s Capital Market Masterplan 2 to facilitate greater retail participation in the bond and sukuk market. The retail bonds and sukuk framework [...]
[[ This is a content summary only. Visit my website for full links, other content, and more! ]]

[[ This is a content summary only. Visit my website for full links, other content, and more! ]]
Download Alternative Investment Strategies And Risk Management ...
Download Alternative Investment Strategies And <b>Risk Management</b> <b>...</b>: Alternative Investment Strategies And Risk Management by Raghurami Reddy Etukuru Mba Caia Alternative Investment Strategies And Risk Management plo. ... In addition to hedge funds, you will find information and guidance on various phases of due diligence; risk metrics, quantitative models and exotic options; commodities, managed futures, private equities, and real estate; brokers, auditors, and legal counsel. Get the information you need to make informed ...
Is Tesco Mounting A Recovery?
Is Tesco Mounting A Recovery?:
Is Tesco Mounting
A Recovery?
A Recovery?
- Tesco shares have rebounded from their recent low
- Recent sales figures look more encouraging
- Its digital investment seems to be paying off
Monday, 10th September 2012
Dear Collective Reader,
It came out of the blue, slashing nearly a quarter off the share price in one fell swoop.Tesco’s (LSE: TSCO) profit warning in January, its first for 20 years, divided investors between bulls, who saw it as a temporary glitch, and bears, who saw more serious writing on the wall.
It wasn’t just among private investors that opinions were sharply divided. Investment guru Warren Buffett rapidly upped his stake in the company to over 5%, while high-yield fund management superstar Neil Woodford took a more pessimistic view, selling out completely. Our analysts at Motley Fool Share Advisor have also been watching the business closely, as it has the sort of dominant market position we love to see.
So how is Tesco faring now?
As far as the share price goes, there has been a little recovery. Tesco shares are up about 15% since the end of May, when they briefly dipped below £3. They have also outpaced the FTSE 100 index of leading UK shares by over 10% over the last six months.
That said, at around 345p, the shares are still some 15% below the level they enjoyed in January, before the aforementioned profit warning.
Hubris
Tesco’s sin was one of hubris, perhaps not surprising in the light of former CEO Terry Leahy’s very long and successful tenure. It took its core UK grocery business for granted, and neglected it in favour of exciting growth opportunities internationally and in non-food business, from out-of-town hypermarkets to banking.
Nemesis came when the UK shopper woke up to Tesco’s poorer customer service and product offering, and its grocery market share slipped. Meanwhile, the new markets proved tough.
Internationally, Tesco lacks the market power it has at home, hypermarkets found online competition tougher than was expected, and some new domestic ventures, such as second-hand cars, were just a step too far.
Tesco’s act of repentance, unveiled by new CEO Philip Clarke in April, was to refocus investment on its core UK grocery operations. Store expansion would be cut back, while more would be spent on refurbishing existing stores, improving staffing, and in price promotions.
Trench warfare
Is it working? Competition in the UK grocery sector is rather like trench warfare. Tesco’s market share is around the 30% level, roughly double that of each of its big three rivals, Sainsbury (LSE: SBRY), Morrison (LSE: MRW) and Asda.
Tesco’s market share has continued slipping all year, but recent figures hint at a turnaround. Measured over the 12 weeks to 5 August, its market share slipped marginally to 30.9%, but in the final four weeks of that period it rose to 31.4%, according to data from Kantar Worldpanel.
In those last four weeks, sales grew 5.1%, ahead of Asda at 4.9%, Sainsbury at 2.7% and Morrison at 1.4%. It’s a very small sign but, as the company says, ‘every little helps’.
Morrison’s results last week showed how it has been struggling recently. Like-for-like sales, a key measure of underlying trading, saw a 0.9% decline over the last six months. Both Tesco and Sainsbury are due to issue their next figures on 3 October, so that will be our next opportunity to assess the state of play.
Digital expansion
One area where Tesco does seem to be stealing a march on the competition is online. It recently bought Mobcast, an online bookstore co-founded by Andy McNab of Bravo Two Zero fame. While the price paid was less than £5m, tiny in the context of Tesco’s overall business, this was the third digital acquisition in a year.
Click & Collect, essentially a drive-through grocery pick-up service, also appears to be gaining some traction, with customers seemingly finding it easier to pop in on the way back from work, rather than wait at home for a set collection window.
All this activity seems to be centred on blending the company’s online and offline presence, which appears to be winning the company plaudits from many quarters.
So, in conclusion, while it seems Tesco shareholders can expect to wait a while yet before the shares recover their previous levels, it seems to have the market and financial power to claw its way back. Nate Weisshaar, an analyst here at Motley Fool Share Advisor, agrees. He believes “Tesco still has the long-run potential for strong international growth and defence of its domestic dominance”.
From: Motley Fool
Health is Wealth
Bullbear Stock Investing Notes
Foreign Funds Sell Off Power
Foreign Funds Sell Off Power:
 Yesterday FBM KLCI big drop where most of the Asia share market is in positive. I think this sell off from foreign funds is testing Malaysia EPF power to push back up the index.
September always not a good month to invest into Malaysia share market. Now is the time to wait for the opportunity to come.
Sure share will go high when QE or ECB start. No money? Just on the printer and print!


September always not a good month to invest into Malaysia share market. Now is the time to wait for the opportunity to come.
Sure share will go high when QE or ECB start. No money? Just on the printer and print!
TESCO - some historical information
TESCO - some historical information:
12.6.2012
TSCO.L
Based on its latest 2012 financial report. Per share (British currency: Pence)
Equity or book value 164.46
EPS 36.64
Dividend 14.76
Historical Information from 2003 - 2012
Revenue GR 10.8%
Pretax Profit Margin 5.2%
EPS GR 11.9%
DPO ratio 43%
ROE 26%
Average High PE 17.4
Average of Historical Average PEs 15.2
Average Low PE 13.0
TescoQ2V2
Health is Wealth
Bullbear Stock Investing Notes
Mfg. Profits Are 35% Above Pre-Recession Levels
Mfg. Profits Are 35% Above Pre-Recession Levels:


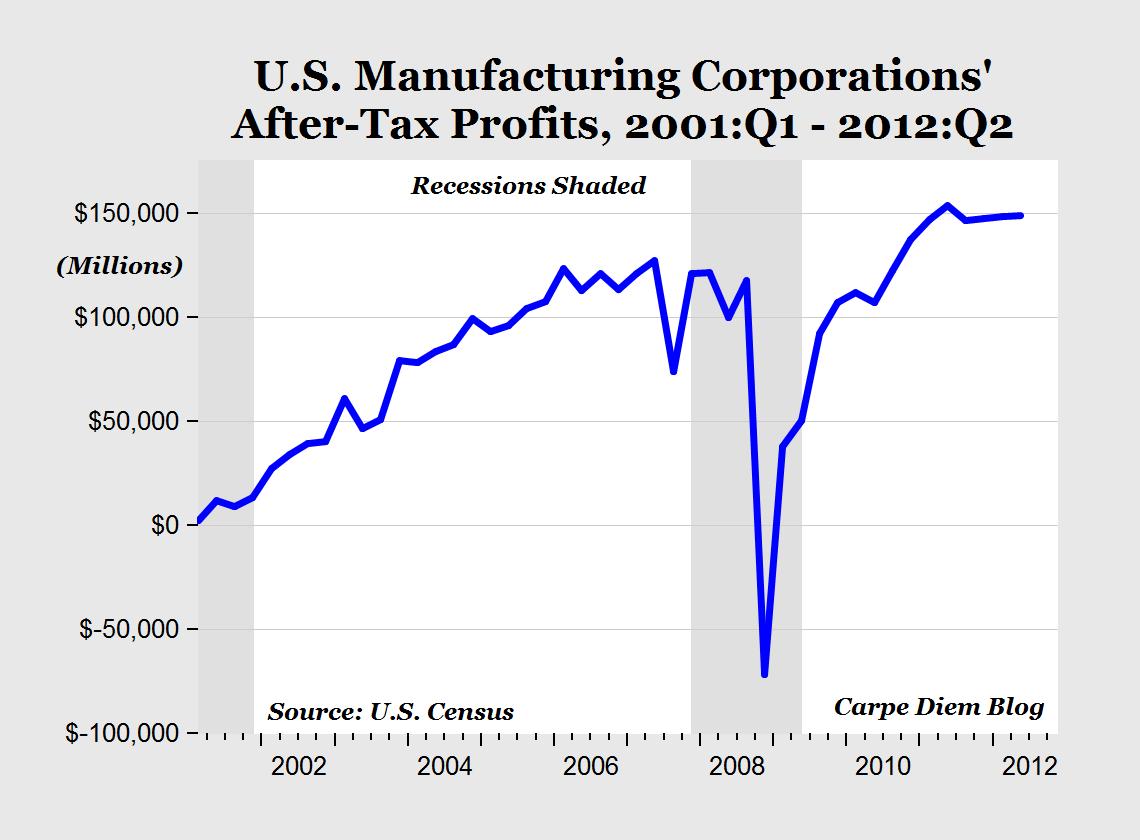
U.S. manufacturers had another solid quarter of profits from April to June, according to data released today by the Census Bureau. The total after-tax profits for American manufacturing corporations totaled more than $149 billion in the second quarter, a slight increase from $148.2 billion in the first quarter of 2012, but down slightly from the all-time quarterly high of $153.4 billion of profits in the second quarter of 2011 (see chart above).
Manufacturing profits have ranged between $146 billion and $153 billion over the last six quarters starting at the beginning of 2011, which contributed to record-setting profits in 2011 on an annual basis of almost $600 billion. Based on the first two quarters of this year, manufacturing profits are on track to approach $600 billion again this year.
In the three years before the recession started (2005-2007), manufacturing profits were averaging about $110.0 billion per quarter, so the recent average of $148.5 billion per quarter since 2011 puts current manufacturing profits 35% above pre-recession levels. This provides evidence of an industry that has not only made a complete recovery from the 2007-2009 recession, but shows that U.S. manufacturers as a group are now actually significantly more profitable than before the recession.
Subscribe to:
Posts (Atom)